- Published on
- // 16 min read
A new metric for DevSecOps adoption
- Authors
- Name
- Shane Boulden
- @shaneboulden


Measurement and metrics are core to DevSecOps programs. DevSecOps thrives on continous improvement, and adapting processes and workflows to new circumstances. Metrics provide feedback that helps improve development and operations, and helps teams to better collaborate and understand where bottlenecks are occurring and resolve them. Metrics also help us to understand how teams are adapting to new processes and workflows, and how users are interacting with software.
You might already be familiar with some of the metrics used to measure software development and DevOps adoption, introduced by the Google DevOps Research and Assessment (DORA) team in 2020. These are:
- Deployment Frequency How often an organization successfully releases to production
- Lead Time for Changes The amount of time it takes a commit to get into production
- Change Failure Rate The percentage of deployments causing a failure in production
- Time to Restore Service How long it takes an organization to recover from a failure in production
In 2021 DORA also introduced a new fifth metric - reliability. Reliability measures modern operational practices, and includes availability, latency, performance, and scalability. Some examples include:
- User-facing behavior
- SLI/SLO metrics and how they affect error budgets
- Use of automation to reduce manual work and alert fatigue
- Defined playbooks to respond to issues
These metrics don't directly answer risk and security questions, though it is implicit. If we patch a critical CVE this is captured in the deployment frequency and lead time for changes, and maybe also the time to restore the service. I'd like to propose another metric though that more explicitly looks at risk - the critical CVE detection frequency. This is the number of critical CVEs detected throughout the application lifecycle.
I've chosen critical CVEs because they've shown to be exploited in the wild at higher rates. The Red Hat Product Security risk report for 2022 showed that 10% of critical-rated security issues were exploited in the wild, compared with 0.4% for overall security issues. Additionally, analysis by the Australian Signals Directorate (ASD) of cybercrime reporting over 2022-2023 also identified that Log4Shell (CVE-2021-44228) and ProxyLogin (CVE-2021-26855) were by far the most commonly exploited vulnerabilities, both of which are assessed as critical.
We could use this metric in a number of ways.
- Critical CVE detection frequency during development This is where we look at using IDE plugins like Red Hat Dependency Analytics to identify critical CVEs during development. This is the earliest stage we could identify CVEs, and shows that CVEs are being actively managed while code is being created.
- Critical CVE detection frequency during builds This metric looks at critical CVE detection rates during CI builds.
- Critical CVE detection frequency at deployment Critical CVE detection rates at the point code runs on the platform (after CI)
- Critical CVE detection frequency at runtime Critical CVEs detected once code has been deployed. This is the last stage in the application lifeycle we can detect critical CVEs, and any detections at this point represent significant risks to the organisation.
Comparing critical CVE detection rates at different stages in the application lifecycle provides us insights into DevSecOps adoption and collaboration. Higher critical CVE detection rates later in the application lifecycle (deployment / runtime) indicates that pipeline-based scanning of CVEs isn't being implemented, or is available but isn't being adopted. Higher critical CVE detection rates earlier in the lifecycle (build / development) indicates that these tools are available and being adopted.
Let's look at a practical application of this metric. Back in late 2021 Log4Shell was disclosed - a flaw in the Java log4j library that was nearly ubiquitous across Java applications, and trivial to exploit. Let's assume we can build Log4Shell CVE scanning into CI pipelines, deployment-time admission control and at runtime. If we focus initially on build-time critical CVE detection rates, we'd hope to see a trend similar to this:

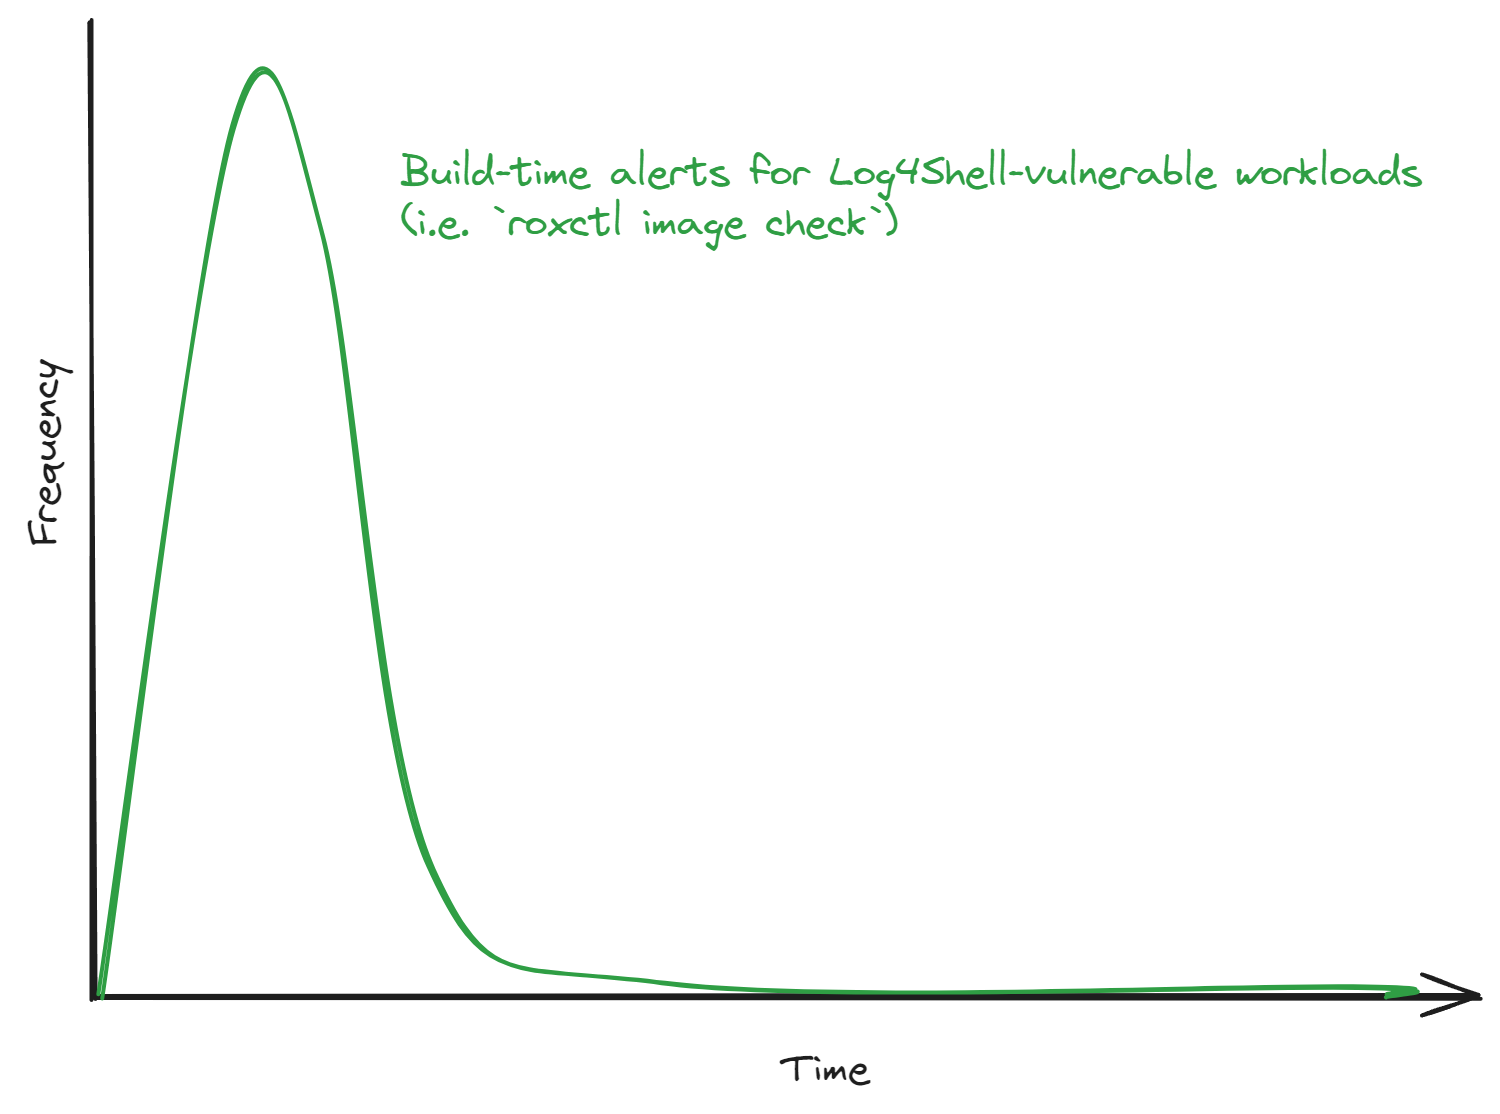
In this example we can see a ramp-up in build-time CVE scan detections which quickly fell off, and eventually trended towards 'zero'. This is great - a trend-line like this would indicate that teams are using CVE scanning tools available throughout CI pipelines, and acting on critical CVE detections.
What if we see a trend-line like this?

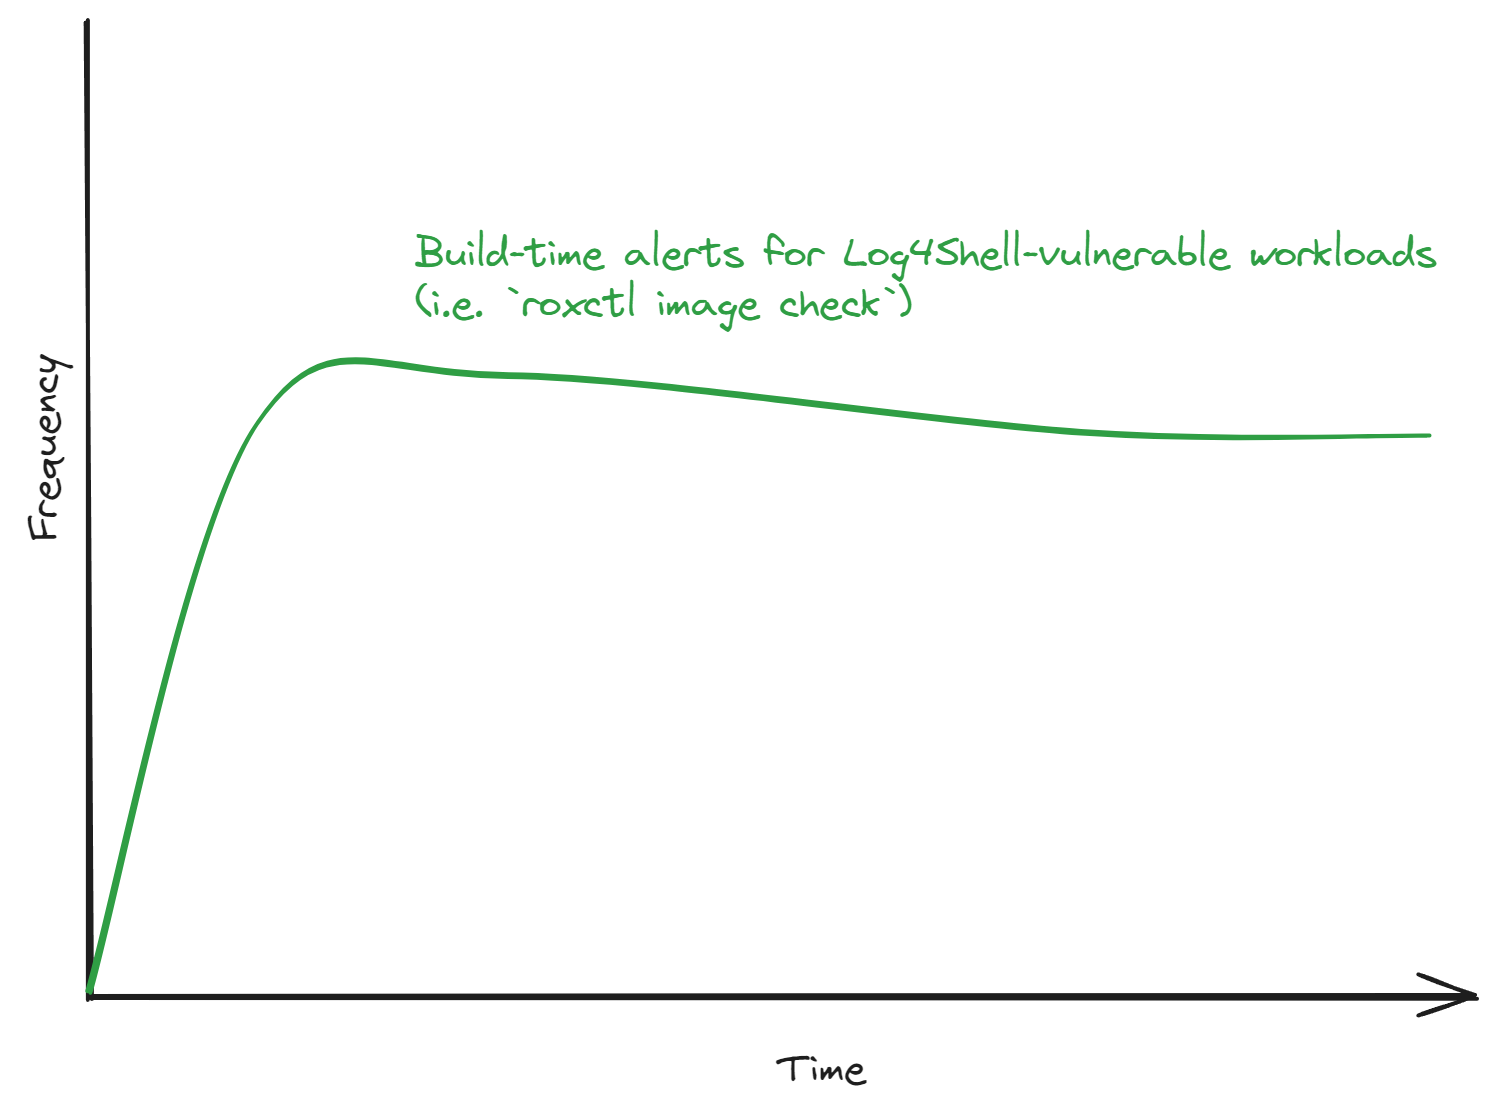
This indicates we have a problem. Log4Shell is being detected, but teams don't seem to care - no one is actioning the CVE detections. It would be really interesting if we could compare build-time with deploy-time notifications, as we might find that teams are simply forcing this code into production, Log4Shell-vulnerable components and all.
What if we want to see how DevSecOps teams are adopting CI-based scanning of container images? One way we could do that is by enabling build-time notifications and deployment-time notifications, and comparing the data sets:

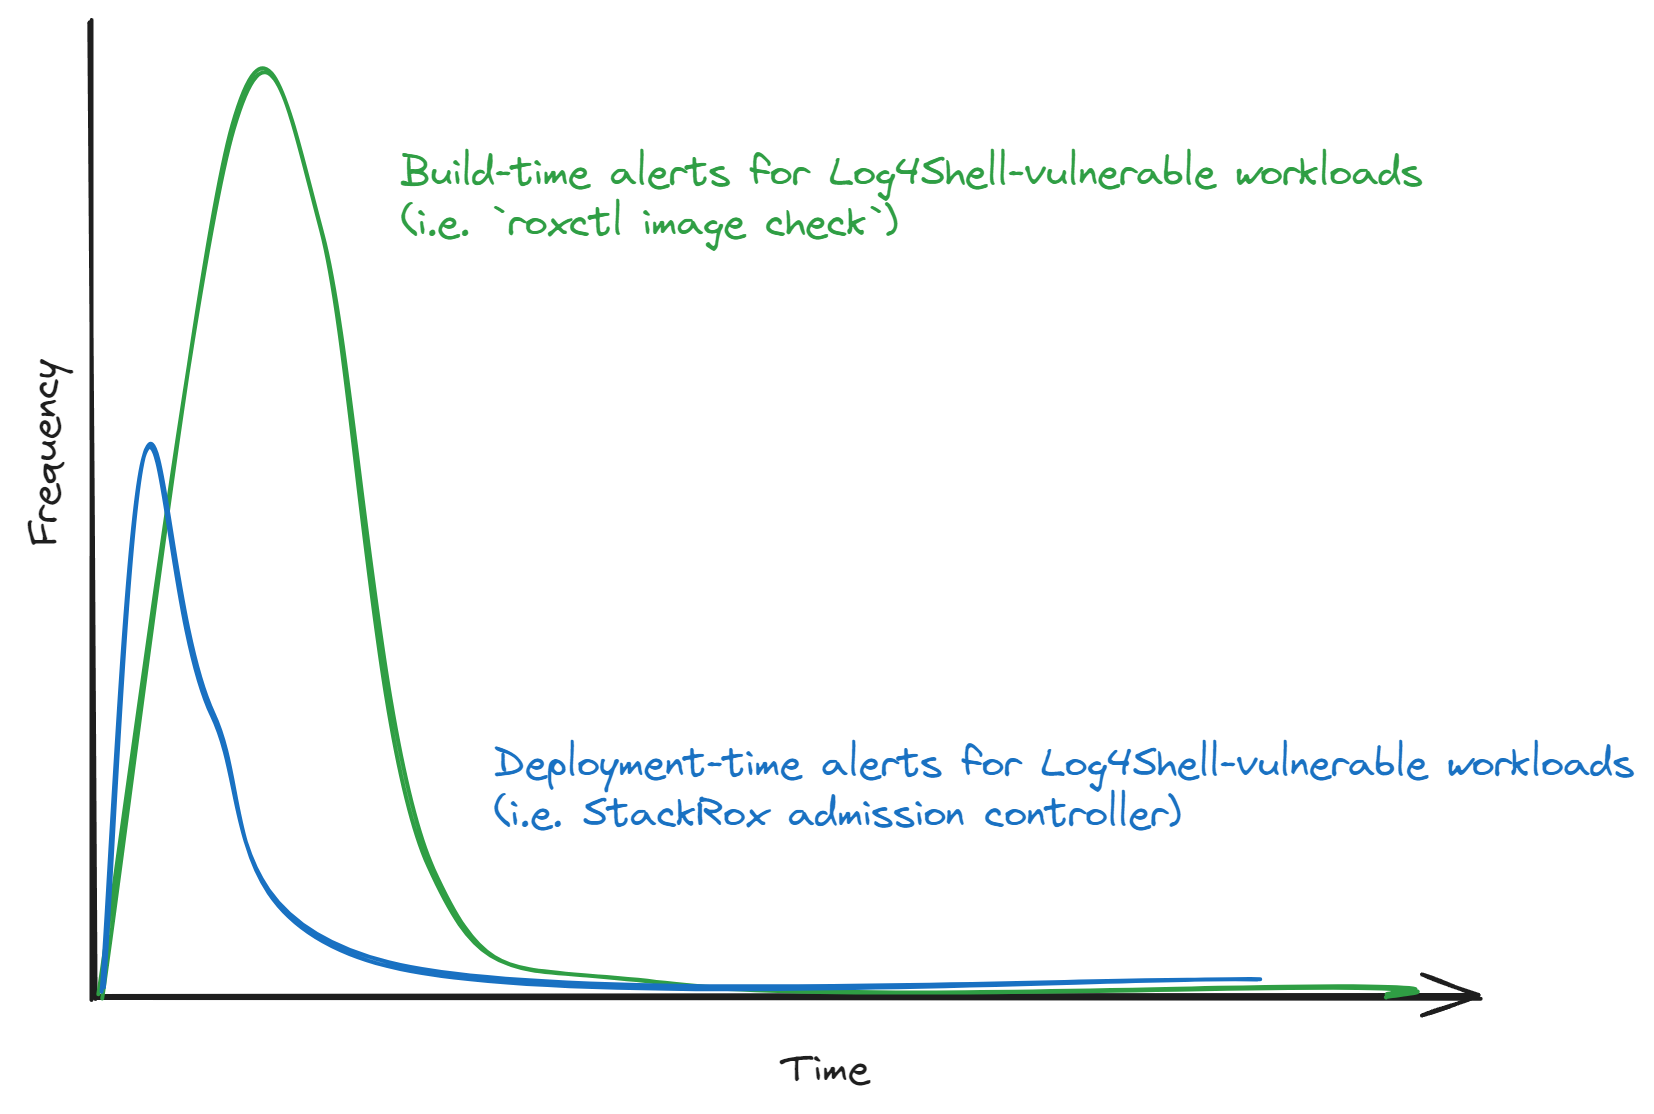
I would be really happy to see this type of trend-line. It indicates that teams are identifying CVEs during CI builds and acting on guidance provided. They're also not simply relying on the admission controller to block vulnerable workloads.
Generating DevSecOps metrics with RHACS
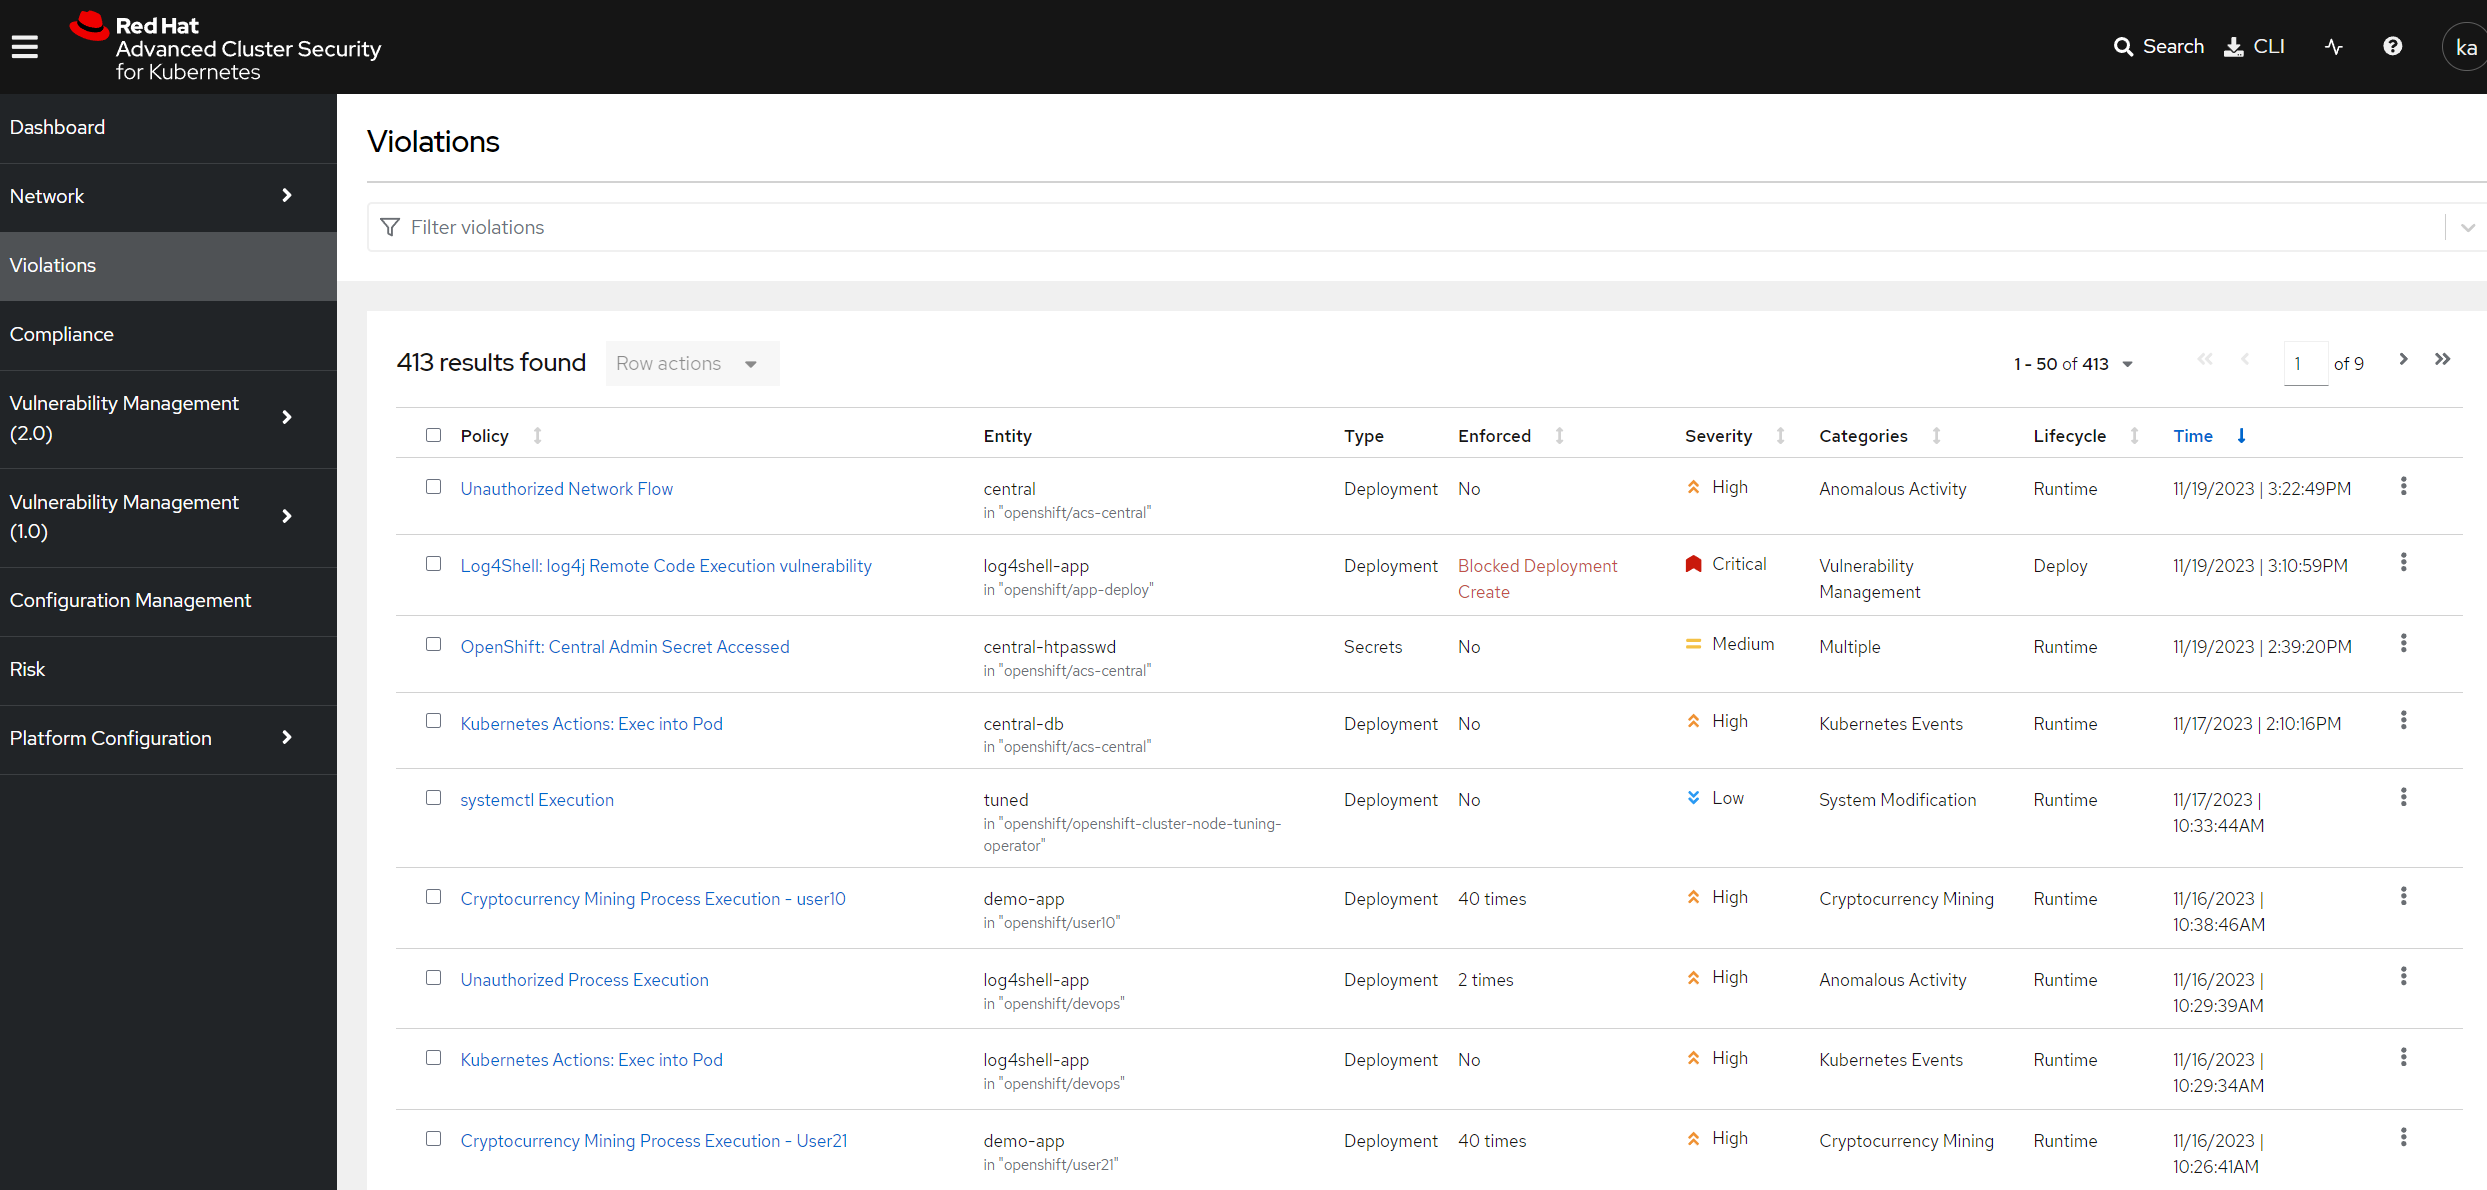
Fortunately we can detect Log4Shell in CI pipelines, deployment-time admission control and at runtime via Red Hat Advanced Cluster Security for Kubernetes (RHACS). RHACS has a concept of 'Violations', which are created each time a security policy is violated and are displayed in the RHACS console and can be forwarded to external SIEMs or other alerting platforms.

A little-known capability of RHACS is that it also supports build-time notifications. This means that when a roxctl image check is performed during a CI build pipelines, we can get notifications about any policy failures. Build-time notifications are sent when the --send-notifications flag is used together with roxctl image check to scan a container image.
So now via RHACS, I have metrics available for:
- build-time, via
roxctl image check --send-notifications. - deployment-time, via the admission controller violations generated by RHACS
- production, via the 'Active' status on CVEs and available via the RHACS RESTful API.
RHACS has a default policy that detects container images vulnerable to log4shell remote code execution vulnerabilties. You can see it here in JSON format:
{
    "id": "cf80fb33-c7d0-4490-b6f4-e56e1f27b4e4",
    "name": "Log4Shell: log4j Remote Code Execution vulnerability",
    "description": "Alert on deployments with images containing the Log4Shell vulnerabilities (CVE-2021-44228 and CVE-2021-45046). There are flaws in the Java logging library Apache Log4j in versions from 2.0-beta9 to 2.15.0, excluding 2.12.2.",
    "rationale": "These vulnerabilities allows a remote attacker to execute code on the server if the system logs an attacker-controlled string value with the attacker's JNDI LDAP server lookup.",
    "remediation": "Update the log4j libary to version 2.16.0 (for Java 8 or later), 2.12.2 (for Java 7) or later. If not possible to upgrade, then remove the JndiLookup class from the classpath: zip -q -d log4j-core-*.jar org/apache/logging/log4j/core/lookup/JndiLookup.class",
    "disabled": false,
    "categories": [
        "Vulnerability Management"
    ],
    "lifecycleStages": [
        "BUILD",
        "DEPLOY"
    ],
    "eventSource": "NOT_APPLICABLE",
    "exclusions": [],
    "scope": [],
    "severity": "CRITICAL_SEVERITY",
    "enforcementActions": [
        "FAIL_BUILD_ENFORCEMENT",
        "SCALE_TO_ZERO_ENFORCEMENT",
        "UNSATISFIABLE_NODE_CONSTRAINT_ENFORCEMENT"
    ],
    "notifiers": [],
    "SORTName": "Log4Shell: log4j Remote Code Execution vulnerability",
    "SORTLifecycleStage": "BUILD,DEPLOY",
    "SORTEnforcement": true,
    "policyVersion": "1.1",
    "policySections": [
        {
            "sectionName": "",
            "policyGroups": [
                {
                    "fieldName": "CVE",
                    "booleanOperator": "OR",
                    "negate": false,
                    "values": [
                        {
                            "value": "CVE-2021-44228"
                        },
                        {
                            "value": "CVE-2021-45046"
                        }
                    ]
                }
            ]
        }
    ],
    "mitreAttackVectors": [],
    "criteriaLocked": true,
    "mitreVectorsLocked": true,
    "isDefault": true
}
There's a few important things to notice about this policy. Firstly, it applies across the 'BUILD' and 'DEPLOY' stages of the application lifecycle. This is referenced here:
{
    ...
    "lifecycleStages": [
        "BUILD",
        "DEPLOY"
    ],
    ...
}
This means that roxctl image check will flag this policy in the output of vulnerable container images. It also means that the RHACS admission controller will flag vulnerable workloads at deployment.
This policy also has enforcement actions set for both the 'BUILD' and 'DEPLOY' lifecycle stages. This is shown here:
    "enforcementActions": [
        "FAIL_BUILD_ENFORCEMENT",
        "SCALE_TO_ZERO_ENFORCEMENT",
        "UNSATISFIABLE_NODE_CONSTRAINT_ENFORCEMENT"
    ],
This means that CI pipelines that integrate roxctl image check will fail - roxctl will emit a non-zero return code. It also means that, if vulnerable workloads are deployed, RHACS will scale the deployment replicas to 'zero', effectively preventing the vulnerable code running on the platform.
Let's look at how we can generate some build-time and deployment-time metrics from this policy.
Configuring an Endpoint
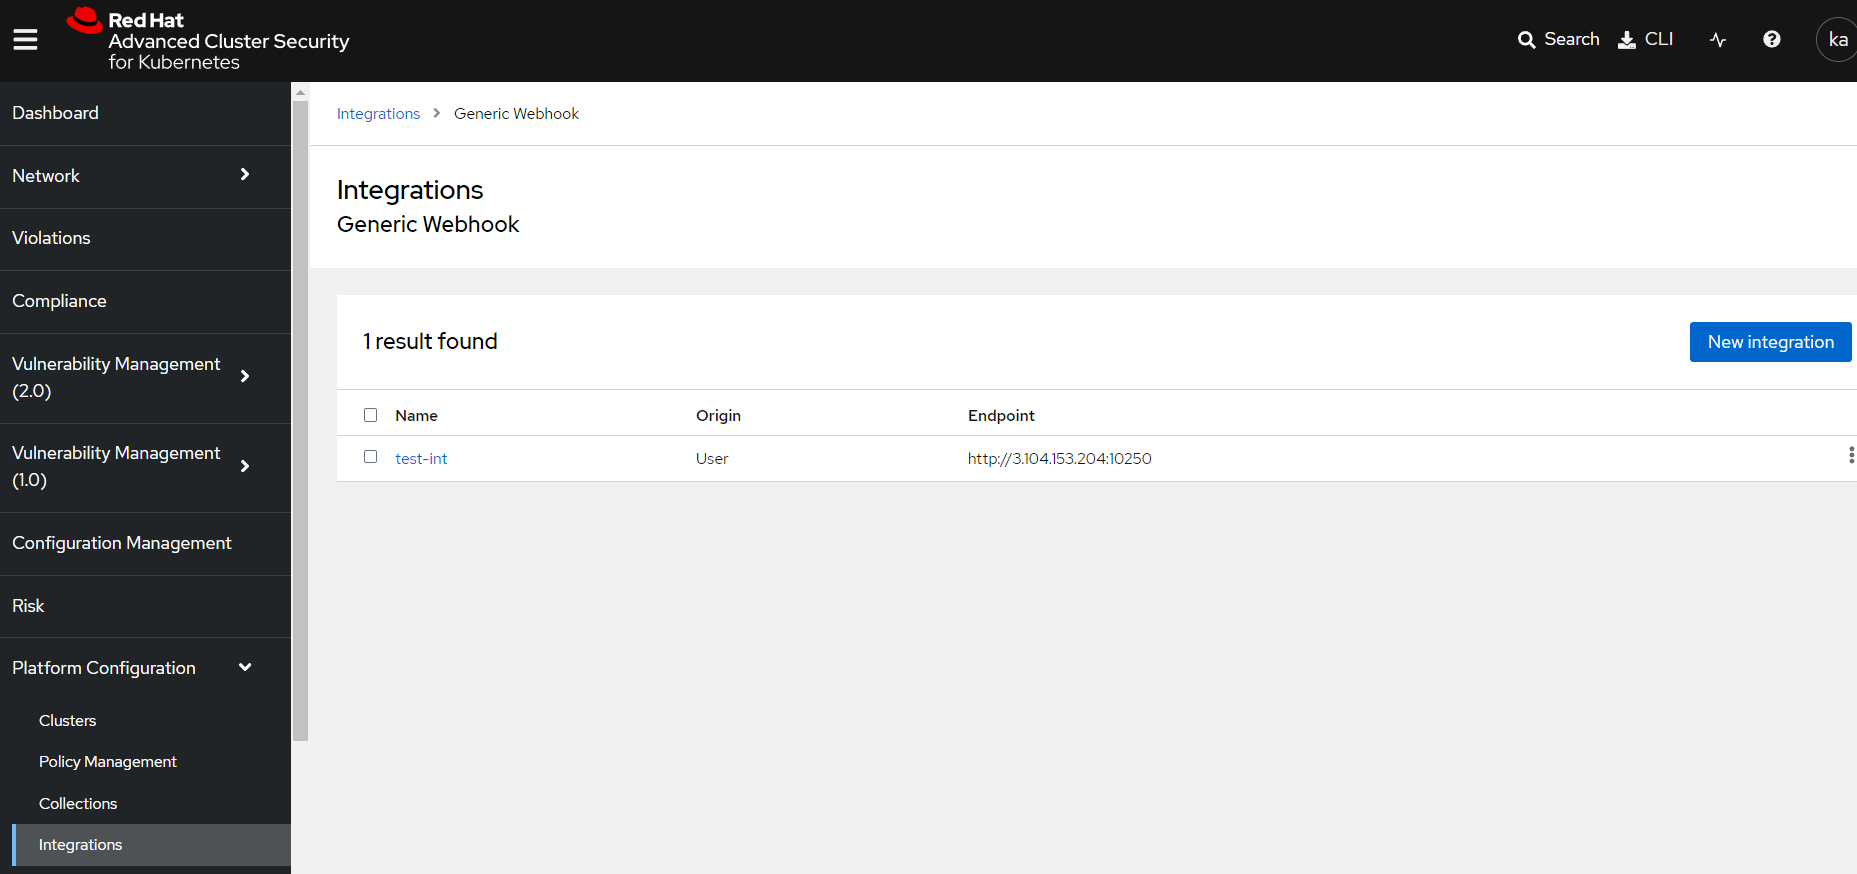
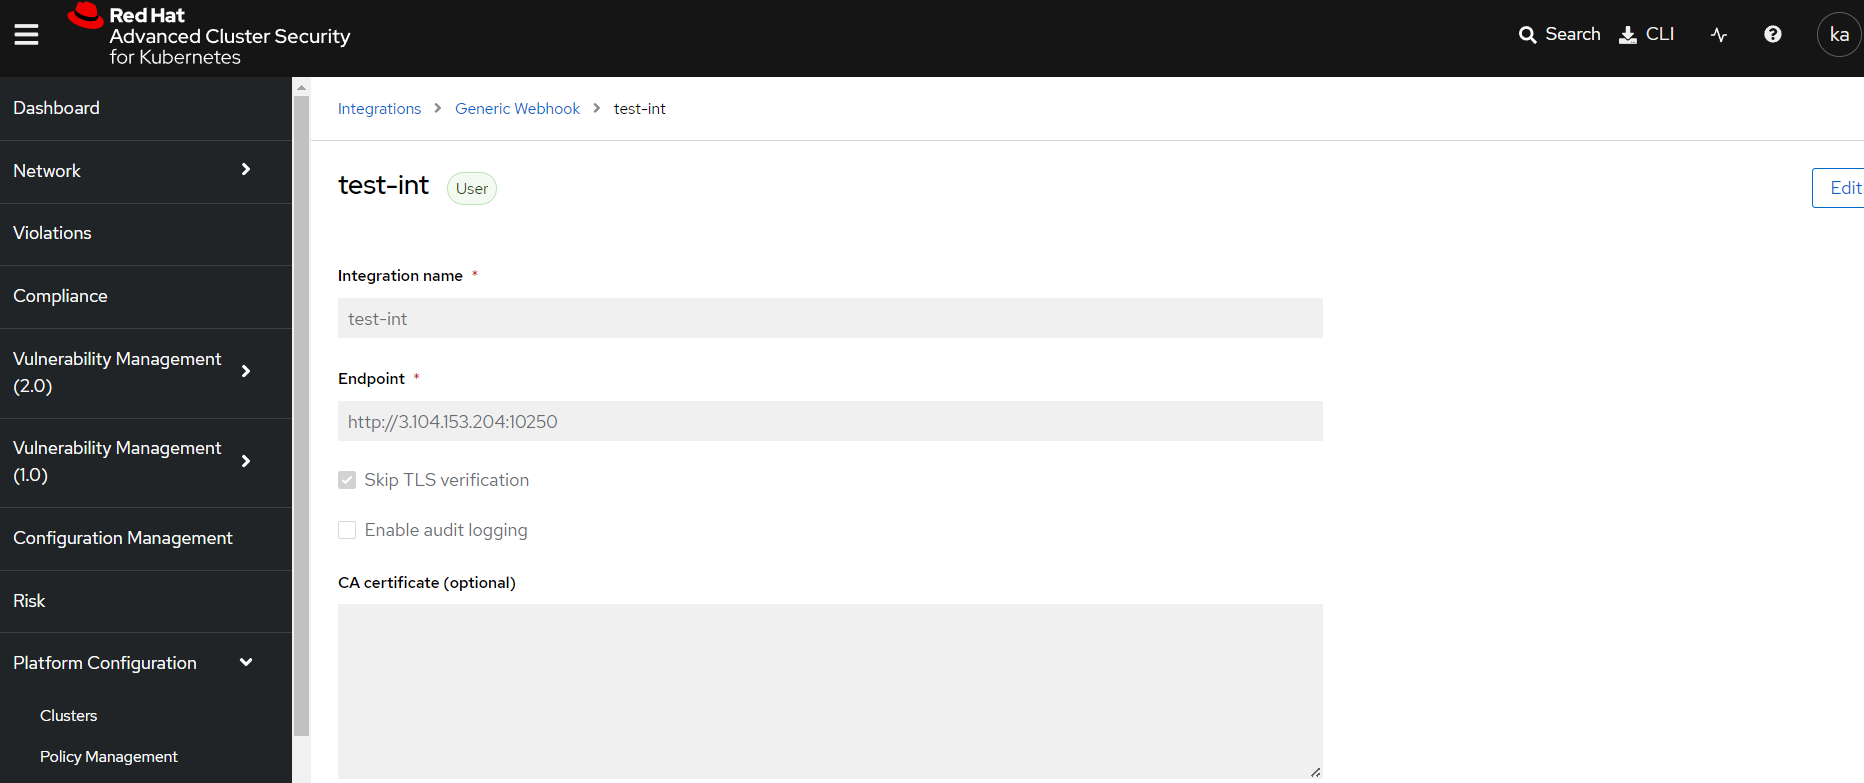
I'm going to use a RHACS notifications to collect metrics about this policy. Before I configure notifications I need to configure a reporting integration. Red Hat Advanced Cluster Security for Kubernetes (RHACS) has a number of built-in integrations I can use, such as AWS Security Hub, Splunk or Sumo Logic. For this article I'm going to simply run netcat in an EC2 instance, and then configure a generic webhook integration to connect to this instance.
nc -lv 10250


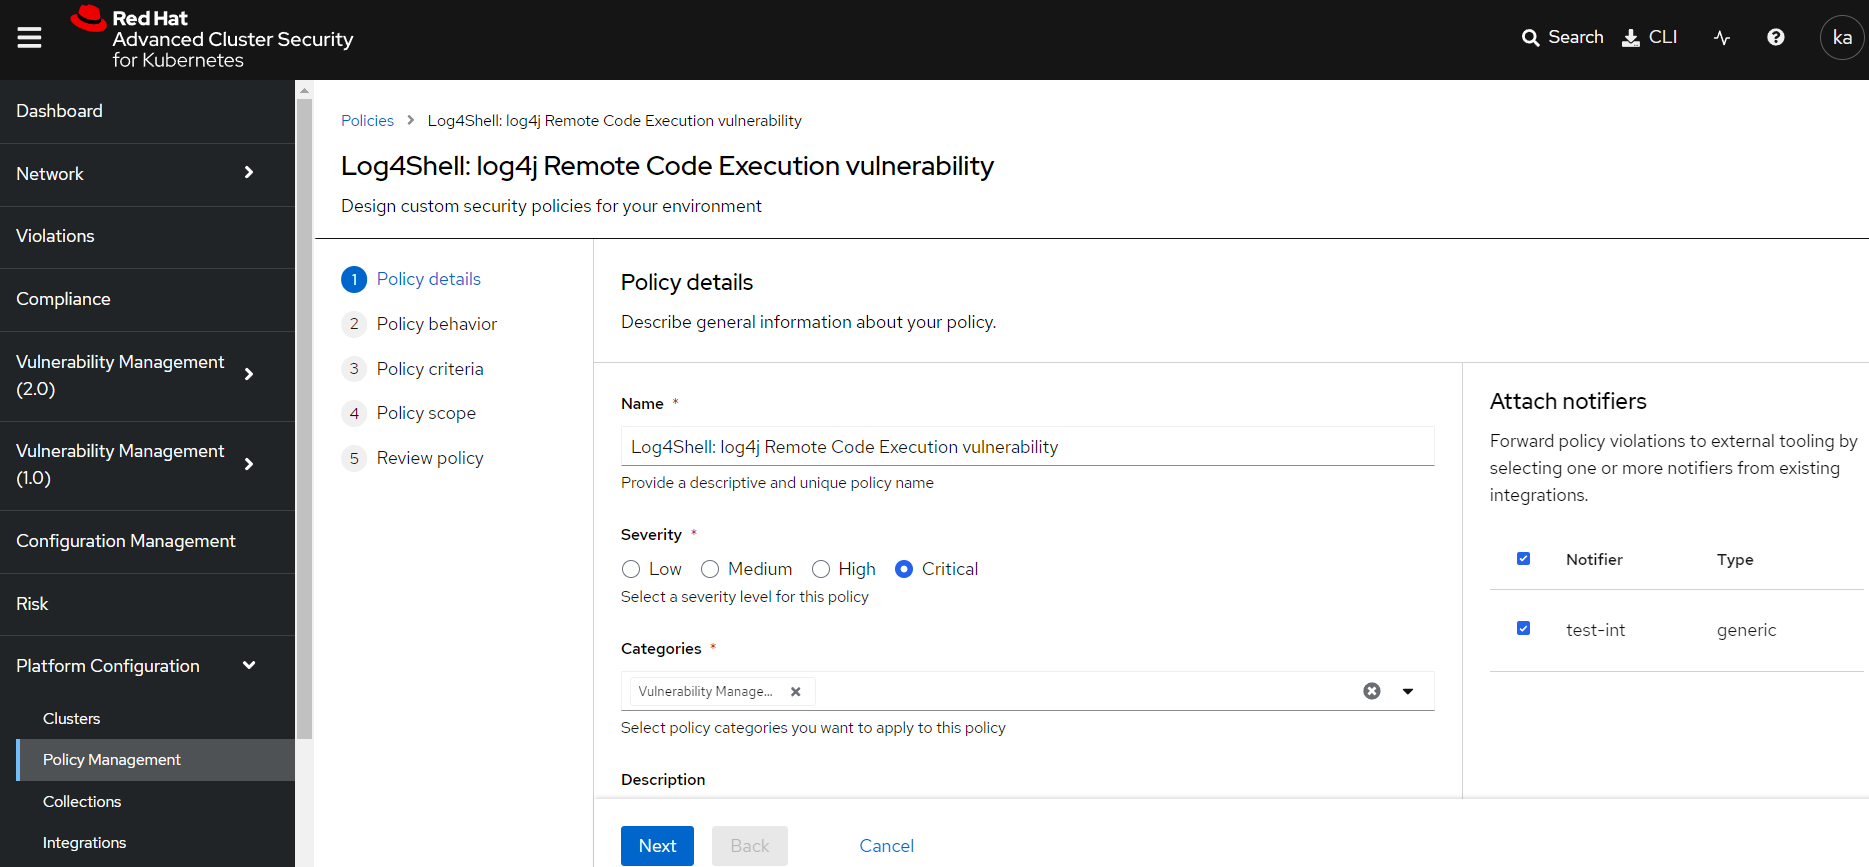
Configuring notifications for a policy
Now that I have an integration created I can attach this to a policy. I can do this by simply editing the policy and attaching an integration in the right-hand menu:

This is then reflected in the policy JSON representation:
{
    "id": "cf80fb33-c7d0-4490-b6f4-e56e1f27b4e4",
    "name": "Log4Shell: log4j Remote Code Execution vulnerability",
    ...
    "notifiers": [
        "d8d77acb-6a46-44ac-894c-64e9af87a926"
    ],
}
Generating metrics
Now that I have a webhook integration created and notifications attached, I can start to look at generating the data I need to measure and report on the critical CVE detection frequency. If I run a roxctl image check and pass the --send-notifications flag, it will generate a build-time notification for any detections:
$ roxctl -e "rhacs:443" --insecure-skip-tls-verify image check --send-notifications --image quay.io/smileyfritz/log4shell-app:v0.5
In the netcat terminal:
nc -lv 10250
Ncat: Version 7.92 ( https://nmap.org/ncat )
Ncat: Listening on :::10250
Ncat: Listening on 0.0.0.0:10250
...
User-Agent: Go-http-client/1.1
Content-Length: 2006
Content-Type: application/json
Accept-Encoding: gzip

{
  "alert": {
    "id": "1de4632d-b195-40e8-abb1-998b0794dbb5",
    "policy": {
      "id": "cf80fb33-c7d0-4490-b6f4-e56e1f27b4e4",
      "name": "Log4Shell: log4j Remote Code Execution vulnerability",
      ...
    }
    "lifecycleStage": "BUILD",
    "image": {
      "id": "sha256:6f14cec2186281d18d2be08158143d73f287964373d00cb956e9ac6277640a45",
      "name": {
        "registry": "quay.io",
        "remote": "smileyfritz/log4shell-app",
        "tag": "v0.5",
        "fullName": "quay.io/smileyfritz/log4shell-app:v0.5"
      }
    },
    "violations": [
      {
        "message": "CVE-2021-44228 (CVSS 10) (severity Critical) found in component 'log4j' (version 2.14.1)"
      },
      {
        "message": "CVE-2021-45046 (CVSS 9) (severity Critical) found in component 'log4j' (version 2.14.1)"
      }
    ],
    "time": "2023-11-17T04:34:23.393738251Z"
  }
}
We can see here that the policy detection generated a 'BUILD' notification:
{
    ...
    "lifecycleStage":"BUILD"
    ...
}
The great thing about this policy is that it will also send notifications about 'DEPLOY' activities also. If I try to deploy the following vulnerable container to a secured cluster:
apiVersion: apps/v1
kind: Deployment
metadata:
  labels:
    app: log4shell-app
    app.kubernetes.io/component: log4shell-app
    app.kubernetes.io/instance: log4shell-app
    app.kubernetes.io/name: log4shell-app
    app.kubernetes.io/part-of: log4shell-app
    app.openshift.io/runtime-namespace: app-deploy
  name: log4shell-app
  namespace: app-deploy
spec:
  progressDeadlineSeconds: 600
  replicas: 0
  revisionHistoryLimit: 10
  selector:
    matchLabels:
      app: log4shell-app
  strategy:
    rollingUpdate:
      maxSurge: 25%
      maxUnavailable: 25%
    type: RollingUpdate
  template:
    metadata:
      annotations:
      labels:
        app: log4shell-app
        deployment: log4shell-app
    spec:
      containers:
      - image: quay.io/smileyfritz/log4shell-app:v0.5
        imagePullPolicy: IfNotPresent
        name: log4shell-app
        ports:
        - containerPort: 8080
          protocol: TCP
        resources: {}
        terminationMessagePath: /dev/termination-log
        terminationMessagePolicy: File
      dnsPolicy: ClusterFirst
      restartPolicy: Always
      schedulerName: default-scheduler
      securityContext: {}
      terminationGracePeriodSeconds: 30
... I should see that the deployment is blocked / scaled to zero, and that a notification is created:


Ncat: Version 7.92 ( https://nmap.org/ncat )
Ncat: Listening on :::10250
Ncat: Listening on 0.0.0.0:10250
...
User-Agent: Go-http-client/1.1
Content-Length: 2829
Content-Type: application/json
Accept-Encoding: gzip

{
  "alert": {
    "id": "6653bdb6-e834-424a-bafb-2f9961fb30a6",
    "policy": {
      "id": "cf80fb33-c7d0-4490-b6f4-e56e1f27b4e4",
      "name": "Log4Shell: log4j Remote Code Execution vulnerability",
      ...
      "lifecycleStages": [
        "BUILD",
        "DEPLOY"
      ],
      ...
    },
    "clusterId": "3b3ffeca-209d-4f7c-92f6-6ebdfcf0a457",
    "clusterName": "openshift",
    "namespace": "app-deploy",
    "deployment": {
      "id": "eaed6d21-1e0d-4134-b559-0f6346d88279",
      "name": "log4shell-app",
      "type": "Deployment",
      "namespace": "app-deploy",
      "labels": {
        "app": "log4shell-app",
        "app.kubernetes.io/component": "log4shell-app",
        "app.kubernetes.io/instance": "log4shell-app",
        "app.kubernetes.io/name": "log4shell-app",
        "app.kubernetes.io/part-of": "log4shell-app",
        "app.openshift.io/runtime-namespace": "app-deploy"
      },
      "clusterId": "3b3ffeca-209d-4f7c-92f6-6ebdfcf0a457",
      "clusterName": "openshift",
      "containers": [
        {
          "image": {
            "name": {
              "registry": "quay.io",
              "remote": "smileyfritz/log4shell-app",
              "tag": "v0.5",
              "fullName": "quay.io/smileyfritz/log4shell-app:v0.5"
            }
          },
          "name": "log4shell-app"
        }
      ],
      "inactive": true
    },
    "violations": [
      {
        "message": "CVE-2021-44228 (CVSS 10) (severity Critical) found in component 'log4j' (version 2.14.1) in container 'log4shell-app'"
      },
      {
        "message": "CVE-2021-45046 (CVSS 9) (severity Critical) found in component 'log4j' (version 2.14.1) in container 'log4shell-app'"
      }
    ],
    "enforcement": {
      "action": "FAIL_DEPLOYMENT_CREATE_ENFORCEMENT",
      "message": "Failed deployment create in response to this policy violation."
    },
    "time": "2023-11-19T05:10:59.074324948Z",
    "firstOccurred": "2023-11-19T05:10:59.074324948Z",
    "state": "ATTEMPTED"
  }
}
Here I can see that the message didn't explicitly show me a "DEPLOY" lifecycle stage, but did give me enough information to infer that this is the case:
- The policy applies to the "BUILD" and "DEPLOY" lifecycle stages
- A notification was generated
- The notification was not a 'BUILD' stage notification
Fantastic - now I have the foundations of a system to generate metrics on 'critical CVE detection rate' frequencies, and generate metrics I can use to provide meaningful feedback to security, development and operations teams.
Wrapping up
In this article I introduced the critical CVE detection frequency as a metric for DevSecOps adoption and feedback, that supports the DevOps Research and Assessment (DORA) metrics. I also explored Red Hat Advanced Cluster Security for Kubernetes (RHACS) build- and deployment-time notifications and using this as a foundation to generate data for this metric. If you have a data analysis platform available, you can get started using these notifications.
The workflow I showed here generates a lot of data that we don't use - I'm not going to use individal CVE detections during a CI build in an investigation, and this data will simply be discarded. In a future article I'll look at a workflow to inject these metrics instead into a time-series database, and provide analysis using open source tools, rather than keeping this superfluous data.